

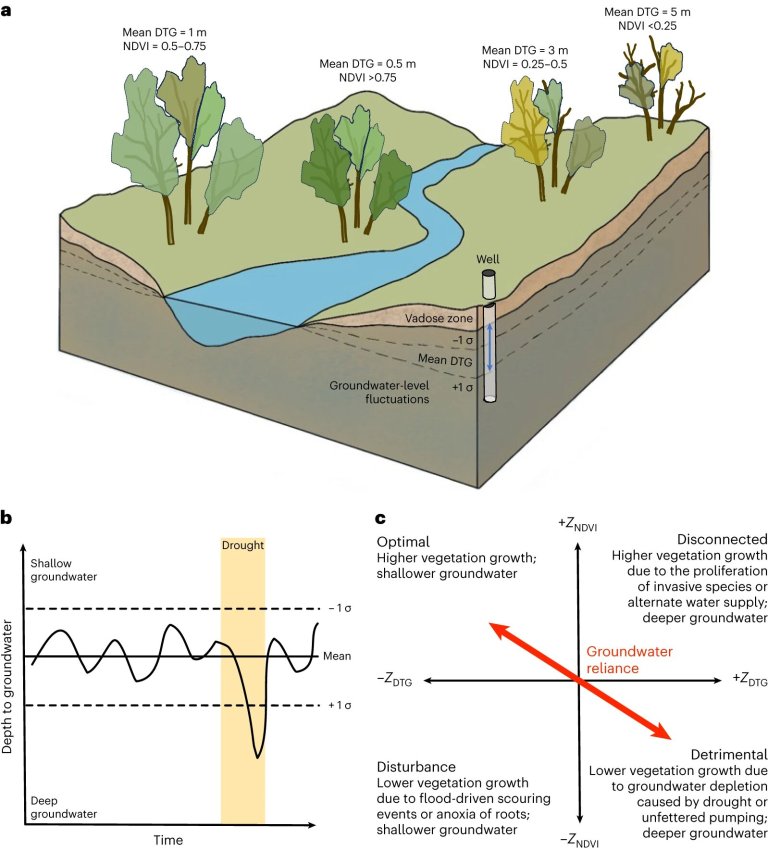
Schematic diagrams of Z score and ecosystem water needs assessments. a, Landscape schematic diagram illustrating how normalized...
Satellites
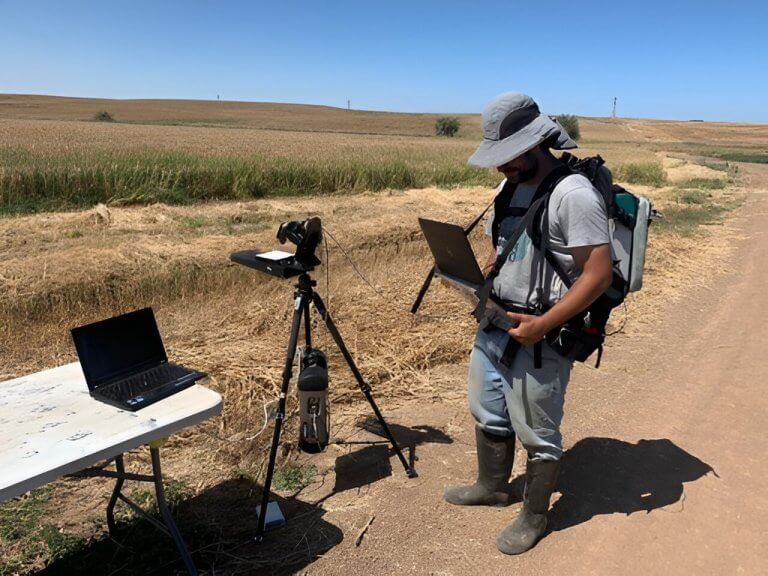
Dual-field of view system for spectral data collection operated by Roy Sadeh. Credit: Asaf Avneri A new...
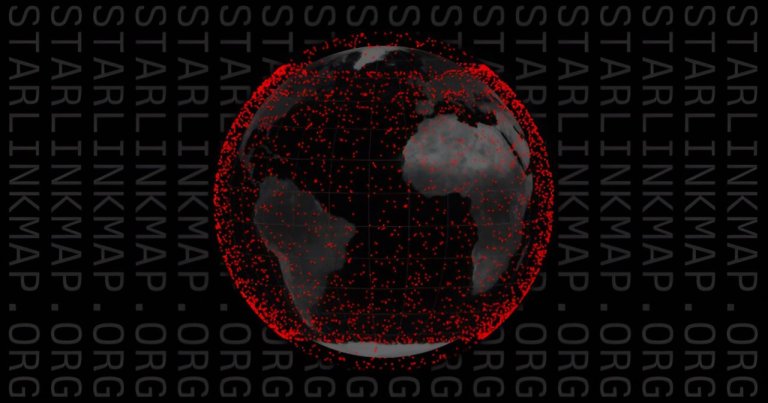
Starlink interactive map offered by SpaceX. Credit: StarlinkMap.org In an effort to enhance the educational outreach of...
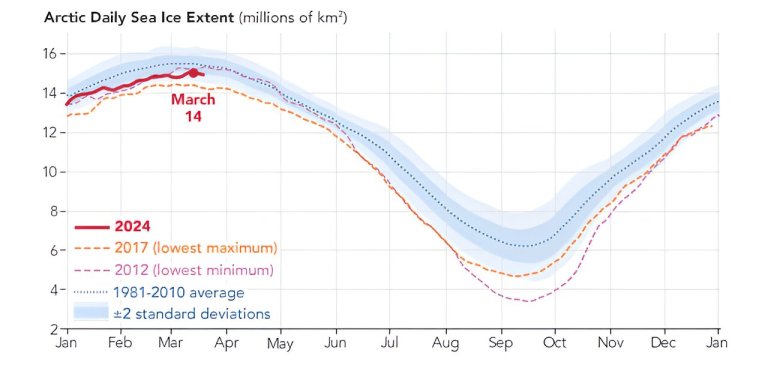
The Arctic Ocean sea ice reached its annual maximum on March 14, continuing the long-term decline in...
Credit: Pixabay/CC0 Public Domain The population on the African continent will have nearly doubled by 2050, according...
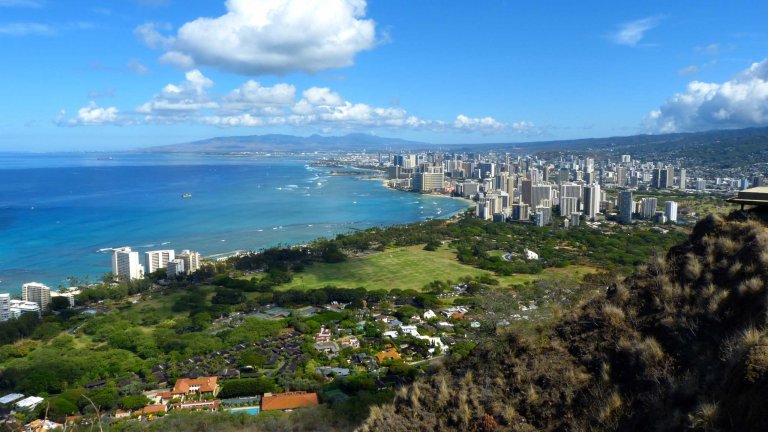
Sea level rise is affecting coastal communities around the world, especially those like Honolulu, pictured, that are...
Scientists are tracking a massive plume of toxic gas moving across northern Europe that was spat out...
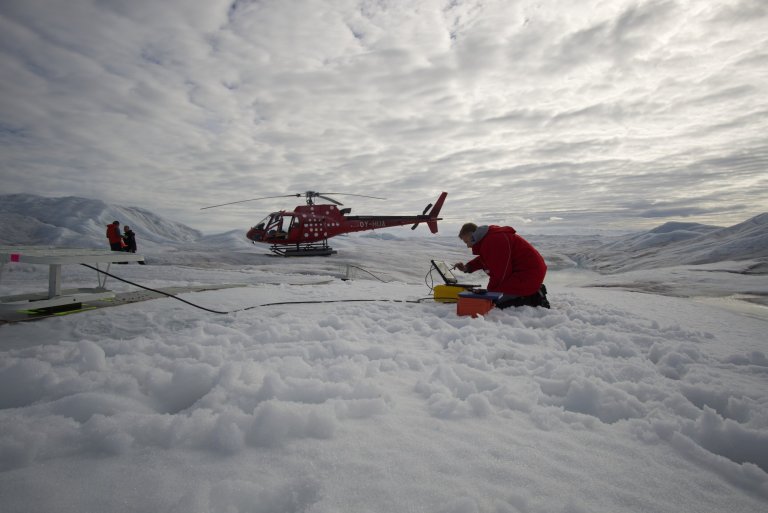
Ole Zeising starting pRES (radar) measurement on 79 North Glacier. Credit: Alfred-Wegener-Institut / Niklas Neckel Ground-based measuring...
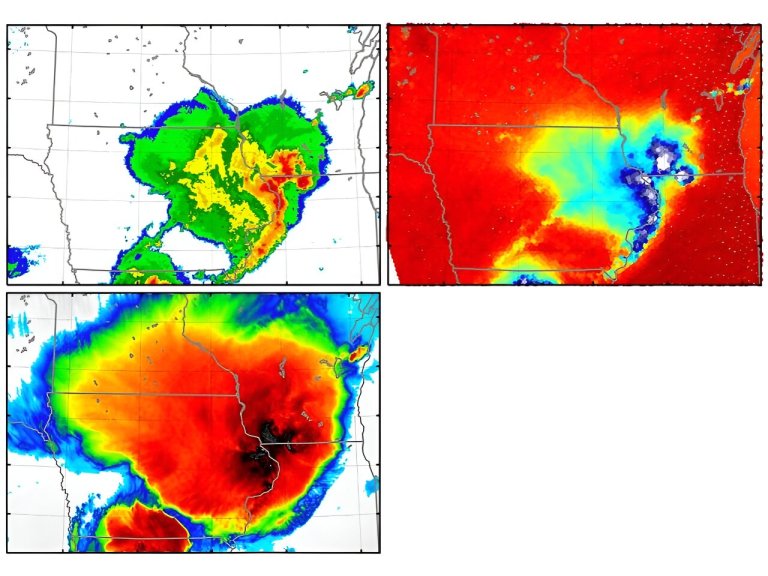
Clockwise from top left: Images of the 2020 Midwest Derecho from radar and microwave satellite observations show...
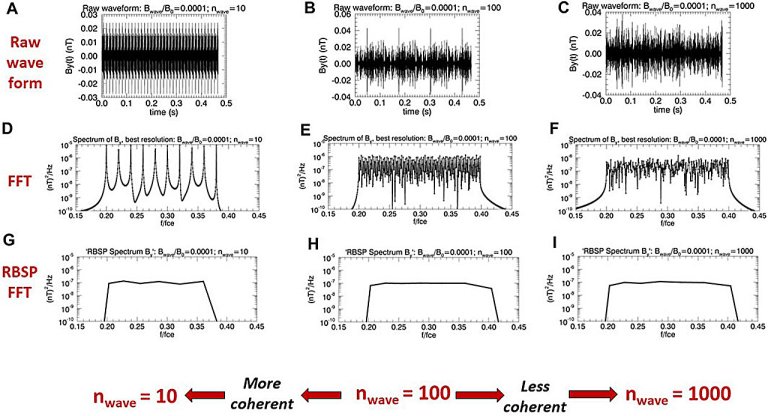
(A–C) show a 0.468s time-series of the By component of whistler-mode wave spectra constructed exactly as done...


