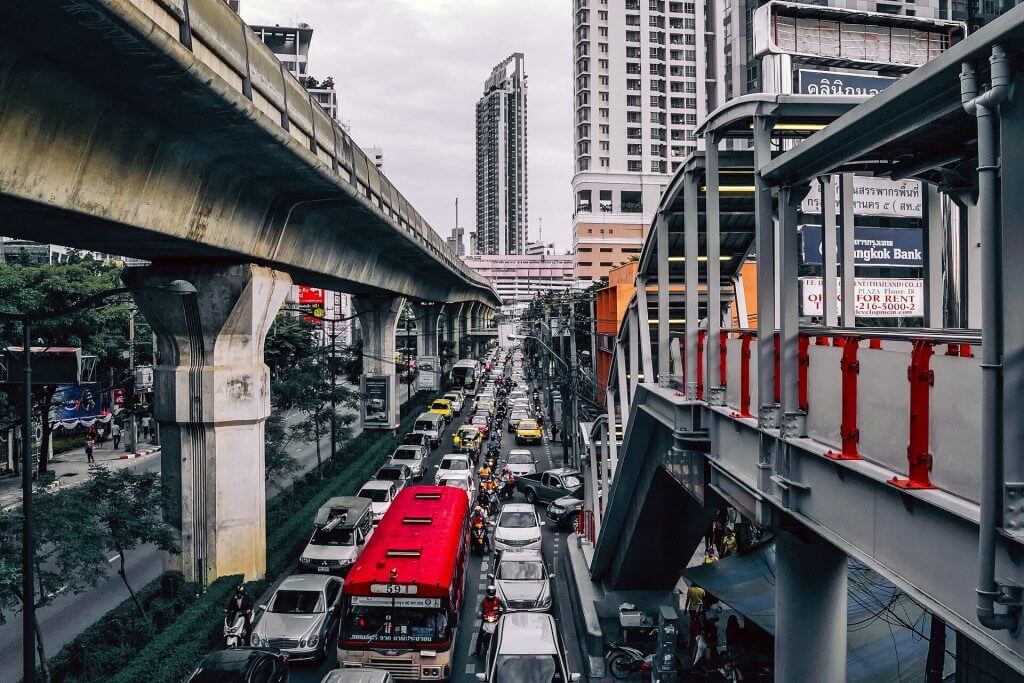
Team uses AI and satellite images to release first-ever global estimates for road transportation greenhouse emissions (Image Credit: Phys.org)

The Environmental Protection Agency estimates that the transportation sector accounts for approximately 27% of all greenhouse gas emissions annually in the United States, and emissions from road transportation—driven by carbon-creating internal combustion vehicles—account for a large majority of that.
For years, researchers have tried to measure these emissions more closely, but existing inventories are often outdated, incomplete and limited.
Now, scientists at the Johns Hopkins Applied Physics Laboratory (APL) in Laurel, Maryland, have leveraged artificial intelligence and machine learning (ML) to produce accurate estimates for road transportation emissions of the top 500 emitting cities worldwide.
“In particular, we were able to estimate the average annual daily traffic on individual road segments in urban areas and combined this with localized estimates of vehicle emissions factors to produce a total emissions estimate,” explained Marisa Hughes, the assistant program manager for Environmental Resilience in APL’s Research and Exploratory Development Mission Area.
“The ability to calculate emissions per road segment provides an unprecedented level of detail and global coverage,” said Hughes, who helps manage the Laboratory’s climate change efforts. “The combination of ML-predicted road activity along with region-specific emissions factors data creates automated, accurate, global, timely and actionable road transportation greenhouse gas emissions estimates.”
Actionable is the key word, Hughes said. “You can’t change what you can’t measure, and that’s a big challenge when it comes to tackling climate change. We need to know where the greenhouse gas emissions are coming from, but that means accounting for a vast number of miniscule contributions across time and geography.”
Making the invisible visible
There are an estimated 1.4 billion motor vehicles in the world. An APL team of experts in remote sensing and computer vision thought they could measure the greenhouse gases from these vehicles by pulling signatures of emissions from visual satellite data, essentially making the invisible visible. They set about looking at existing emissions data, correlating it with those images, teasing out anything they could with neural networks.
Then the team realized there was another way to address the challenge, Hughes said. APL had experience in mapping patterns of life for the Intelligence Community on a project called Functional Map of the World, where experts mapped out land use and structures, and used satellite data from different times of day to understand and differentiate between similar-looking structures, like office buildings versus apartment complexes.
“We thought, what if we took this same ‘pattern of life’ analysis, and instead of focusing on buildings, we looked at networks of roads that were connecting them,” recalled Derek Rollend, a senior ML researcher at APL. “We built a deep neural network that would take inputs that were available globally: satellite imagery, road network data and population.”
Because some areas had fine-grained emissions and vehicle count data, “we were able to train our machine learning models with this ground-truth data on vehicle activity there, and then apply the model predictions first at the country level, and most recently for the top 500 cities globally,” he continued.
This work contributes a major piece to a larger effort to monitor greenhouse gas emissions on a global scale, conducted by Climate TRACE [Tracking Real-time Atmospheric Carbon Emissions], an international coalition created to make meaningful climate action faster and easier by independently tracking greenhouse gas emissions with unprecedented detail and speed.
This work represents how APL is bringing its unique expertise to make sustainable contributions to the global challenges of climate change.
“It is a great example of how our unique skills and capabilities across machine learning, satellite imaging and systems modeling can be applied to understand and one day solve complex problems,” said Bobby Armiger, who along with Hughes co-leads the Labwide focus on climate change research.
On Nov. 9, Climate TRACE released the most detailed inventory of greenhouse gas emissions ever compiled, providing asset-level emissions data for 81,087 individual sources worldwide—and APL’s transportation data was a part of that release. In addition to releasing facility-level information, Climate TRACE updated its independent inventory of emissions from every country to include data from 2021, providing a full view of annual greenhouse gas emissions since 2015—the year of the Paris Agreement, an international treaty on climate change.
Bringing radical transparency to global emissions
Members of the Climate TRACE coalition have rallied around a goal they call radical transparency.
“It’s about knowing where all the greenhouse gases are, where the emissions are coming from, and, at the same time, being very open about how we are calculating those emissions,” Hughes said. “That’s a really big challenge. But if you’ve got that radical transparency, then you can dive in and start to do some analysis and some comparisons to figure out what’s working and what’s not in terms of mitigating emissions.”
One of the coalition’s goals for the coming year is to understand how to bring differently sourced, overlapping data sets and emissions inventories together to create a new best estimate of what’s really going on.
“That dream of radical transparency and knowing where all of the emissions are coming from in real time with every new satellite image is still a ways ahead of us,” Hughes said. “But now it feels within reach.”
Provided by
Johns Hopkins University
Team uses AI and satellite images to release first-ever global estimates for road transportation greenhouse emissions (2022, November 10)
retrieved 11 November 2022
from https://phys.org/news/2022-11-team-ai-satellite-images-first-ever.html
part may be reproduced without the written permission. The content is provided for information purposes only.


