


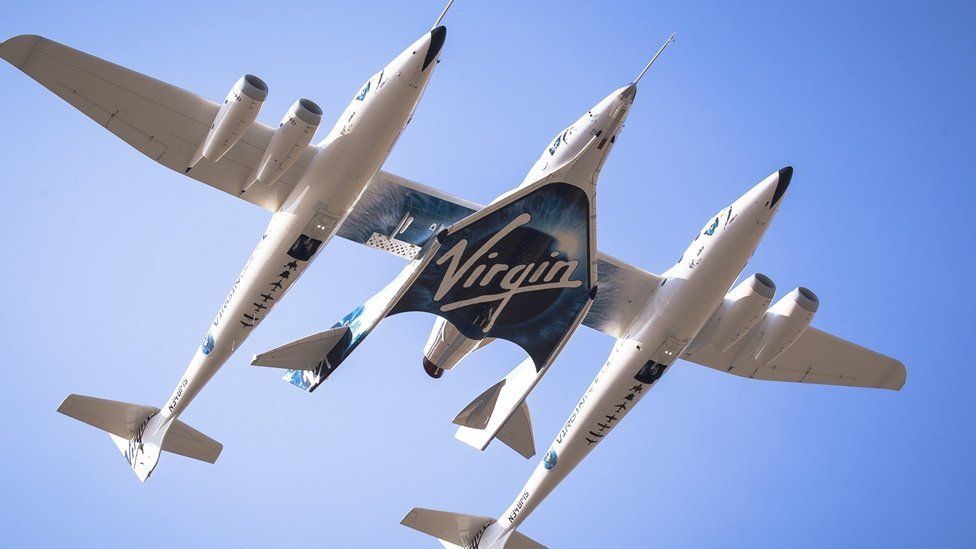
Virgin Galactic CEO Michael Colglazier had reason to be upbeat during the company’s earnings call last week. The company’s mothership, VMS Eve, had flown back to Spaceport America the day before following a 16-month overhaul at the Mojave Air and Space Port at Rutan Field in California.
The 14-year old airplane has been upgraded with a new launch pylon and horizontal stabilizers as well as updated avionics and mechanical systems, Colglazier said. A series of flight tests are scheduled, including one in which VMS Eve will drop SpaceShipTwo VSS Unity for a glide flight. That will be followed by the completion of the spacecraft’s flight test program with a powered suborbital flight by VSS Unity with four Virgin Galactic employees in the passenger cabin.
In the second quarter, the “world’s first commercial spaceline” will begin carrying paying passengers after more than 18 years of effort, Colglazier said. The first flight will carrying three Italian Air Force pilots, who will conduct microgravity experiments during three minutes of weightlessness. VSS Unity will then begin flying the first of 800 ticketholders. After the first several flights, the spacecraft will begin to fly on a monthly basis, Colglazier said.
While these commercial flights will eventually bring in millions of dollars, there were clear signs during the earnings call that Virgin Galactic still has a long road ahead to profitability. Much of the challenge relates to the limits of the company’s technology.
SpaceShipTwo was originally intended to carry two pilots and six passengers. However, VSS Unity can only carry four passengers due to performance limitations. On research flights, the four seats will be replaced with racks holding experiments.
Officials said revenue from the first six flights will be $600,000 per launch. A Virgin Galactic astronaut trainer will accompany paying passengers on these flights in order to evaluate the experience and make recommendations for changes.
The revenue figure of $200,000 per seat on these initial commercial flights reflects what early ticketholders paid when they reserved their seats beginning in 2005. Virgin Galactic raised the ticket prices to $250,000 in 2013. The company increased the price a second time to $450,000 in August 2021.
Revenue will increase as Virgin Galactic begins to fly customers with higher-priced tickets. Virgin Galactic has reserved 100 flights in its first tranche of launches to fly microgravity science experiments and technology demonstrations.
Scientists will fly with their payloads on some of the research flights. Southwest Research Institute’s Alan Stern is set to fly on a pair of flights. Steve Collicott of Purdue University will accompany one of his experiments into space.
Ballooning Costs
A large part of the reason why ticket prices have more than doubled are the massive delays and and cost overruns the program has experienced. After announcing plans to build SpaceShipTwo in September 2004, founder Richard Branson predicted Virgin Galactic would begin commercial flights as early as 2007. The Virgin Group originally invested $110 million in the project, but that figure was long ago surpassed.
Virgin Galactic Revenue and Losses
2018 – 2022
| Year | Revenue | Net Loss |
|---|---|---|
| 2022 | $2,312,000 | $500,152,000 |
| 2021 | $2,292,000 | $352,899,000 |
| 2020 | $238,000 | $644,881,000 |
| 2019 | $3,781,000 | $210,935,000 |
| 2018 | $2,849,000 | $138,139,000 |
| Total | $12,472,000 | $1,847,006,000 |
An examination of the Virgin Galactic’s public filings with the Securities and Exchange Commission (SEC) reveals the company suffered a net loss of nearly $1.85 billion in the past five years alone. Total revenue during the five-year period totaled just under $12.5 million.
More than a quarter of that five-year net loss — $500.1 million — came in 2022 as the company overhauled VMS Eve, prepared for the start of commercial service, and laid plans for a fleet of vehicles. Revenue for last year totaled $2.3 million.
Virgin Galactic has $890 million in cash and reserves. This gives the company a runway of nearly two years, not counting the revenues commercial flights generate.
Fleet Expansion Paused
Virgin Galactic officials had previously said that VSS Unity would be joined by a sister ship, VSS Imagine, that would be capable of flying twice per month. However, officials said plans to bring the second spacecraft into commercial service have been placed on hold.
Colglazier said that flying VSS Imagine is an option at some point in the future. However, the company is primarily on focused on two priorities: getting VSS Unity to a monthly flight cadence, and developing next generation of SpaceShipTwos and WhiteKnightTwo motherships.
The new Delta-class spaceships are being designed to fly much more frequently and with far less maintenance than VSS Unity. A fleet of these ships is seen as crucial to Virgin Galactic’s future in that they will bring in much more revenue at lower operating costs. The new vehicles are expected to be ready for flight tests in 2025 — during which they could carry paid experiments — with passenger service beginning in 2026.
Virgin Galactic signed contracts for development of the Delta-class spacecraft and WhiteKnightTwo carrier aircraft. Officials said this year would be focused to completing the design of the vehicles, designing parts and fabricating tooling.
Virgin Galactic’s fourth quarter and full year financial results are below.
VIRGIN GALACTIC HOLDINGS, INC.
Condensed Consolidated Statements of Operations and Comprehensive Loss
(In thousands, except for per share amounts)
| Three Months Ended December 31, 2022 | Three Months Ended December 31, 2021 | Year Ended December 31, 2022 | Year Ended December 31, 2021 | |||||||||
| Revenue | $ | 869 | $ | 141 | $ | 2,312 | $ | 3,292 | ||||
| Operating expenses: | ||||||||||||
| Customer experience | 1,169 | 2 | 1,906 | 272 | ||||||||
| Selling, general and administrative | 47,298 | 38,311 | 175,118 | 166,814 | ||||||||
| Research and development | 102,596 | 40,226 | 314,174 | 144,223 | ||||||||
| Depreciation and amortization | 3,117 | 2,883 | 11,098 | 11,518 | ||||||||
| Total operating expenses | 154,180 | 81,422 | 502,296 | 322,827 | ||||||||
| Operating loss | (153,311 | (81,281) | (499,984) | (319,535) | ||||||||
| Interest income | 6,175 | 423 | 12,502 | 1,208 | ||||||||
| Interest expense | (3,206) | (6) | (12,130) | (25) | ||||||||
| Change in fair value of warrants | — | — | — | (34,650) | ||||||||
| Other income, net | 51 | 72 | 58 | 182 | ||||||||
| Loss before income taxes | (150,291) | (80,792) | (499,554) | (352,820) | ||||||||
| Income tax expense | 529 | 5 | 598 | 79 | ||||||||
| Net loss | (150,820) | (80,797) | (500,152) | (352,899) | ||||||||
| Other comprehensive income (loss): | ||||||||||||
| Foreign currency translation adjustment | 167 | 118 | (146) | 129 | ||||||||
| Unrealized gain (loss) on marketable securities | 2,916 | (1,566) | (5,311) | (2,003) | ||||||||
| Total comprehensive loss | $ | (147,737) | $ | (82,245) | $ | (505,609) | $ | (354,773) | ||||
| Net loss per share: | ||||||||||||
| Basic and diluted | $ | (0.55) | $ | (0.31) | $ | (1.89) | $ | (1.43) | ||||
| Weighted-average shares outstanding: | ||||||||||||
| Basic and diluted | 274,902 | 257,888 | 263,947 | 247,619 |
VIRGIN GALACTIC HOLDINGS, INC.
Condensed Consolidated Balance Sheets
(In thousands)
| December 31, 2022 | December 31, 2021 | |||||
| Assets | ||||||
| Current assets: | ||||||
| Cash and cash equivalents | $ | 302,291 | $ | 524,481 | ||
| Restricted cash | 40,336 | 25,549 | ||||
| Marketable securities, short-term | 606,716 | 79,418 | ||||
| Inventories | 24,043 | 29,668 | ||||
| Prepaid expenses and other current assets | 28,228 | 19,476 | ||||
| Total current assets | 1,001,614 | 678,592 | ||||
| Marketable securities, long-term | 30,392 | 301,463 | ||||
| Property, plant and equipment, net | 53,658 | 47,498 | ||||
| Other non-current assets | 54,274 | 41,281 | ||||
| Total assets | $ | 1,139,938 | $ | 1,068,834 | ||
| Liabilities and Stockholders’ Equity | ||||||
| Current liabilities: | ||||||
| Accounts payable | 16,326 | 9,237 | ||||
| Accrued liabilities | 61,848 | 28,787 | ||||
| Customer deposits | 102,647 | 90,863 | ||||
| Other current liabilities | 3,232 | 2,636 | ||||
| Total current liabilities | 184,053 | 131,523 | ||||
| Non-current liabilities: | ||||||
| Convertible senior notes, net | 415,720 | — | ||||
| Other long-term liabilities | 59,942 | 43,047 | ||||
| Total liabilities | 659,715 | 174,570 | ||||
| Stockholders’ Equity | ||||||
| Preferred stock | — | — | ||||
| Common stock | 28 | 26 | ||||
| Additional paid-in capital | 2,111,316 | 2,019,750 | ||||
| Accumulated deficit | (1,623,795) | (1,123,643) | ||||
| Accumulated other comprehensive loss | (7,326) | (1,869 | ||||
| Total stockholders’ equity | 480,223 | 894,264 | ||||
| Total liabilities and stockholders’ equity | $ | 1,139,938 | $ | 1,068,834 |
VIRGIN GALACTIC HOLDINGS, INC.
Condensed Consolidated Statements of Cash Flows
(In thousands)
| Three Months Ended December 31, 2022 | Three Months Ended December 31, 2021 | Year Ended December 31, 2022 | Year Ended December 31, 2021 | |||||||||
| Cash flows from operating activities: | ||||||||||||
| Net loss | $ | (150,820) | $ | (80,797) | $ | (500,152) | $ | (352,899) | ||||
| Stock-based compensation | 11,221 | 13,101 | 45,709 | 61,805 | ||||||||
| Depreciation and amortization | 3,123 | 2,883 | 11,098 | 11,518 | ||||||||
| Amortization of debt issuance costs | 532 | — | 1,998 | — | ||||||||
| Change in fair value of warrant liability | — | — | — | 34,650 | ||||||||
| Other non-cash items | 538 | 53 | 10,800 | 11 | ||||||||
| Change in operating assets and liabilities: | ||||||||||||
| Inventories | (1,192) | (363) | 5,625 | 815 | ||||||||
| Other current and non-current assets | (5,063) | (9,807) | (2,810) | (3,465) | ||||||||
| Accounts payable and accrued liabilities | 11,323 | 6,111 | 35,151 | 7,935 | ||||||||
| Customer deposits | (1,324) | 5,504 | 11,784 | 7,652 | ||||||||
| Other current and long-term liabilities | 420 | (1,811) | 556 | 1,215 | ||||||||
| Net cash used in operating activities | (131,242) | (65,126) | (380,241) | (230,763) | ||||||||
| Cash flows from investing activities: | ||||||||||||
| Capital expenditures | (4,183) | (2,183) | (16,489) | (4,635) | ||||||||
| Purchases of marketable securities | (99,620) | (96,752) | (704,565) | (382,884) | ||||||||
| Proceeds from maturities and calls of marketable securities | 140,277 | — | 434,889 | — | ||||||||
| Net cash provided by (used in) investing activities | 36,474 | (98,935) | (286,165) | (387,519) | ||||||||
| Cash flows from financing activities: | ||||||||||||
| Payments of finance lease obligations | (102) | (35) | (234) | (140) | ||||||||
| Proceeds from convertible senior notes | — | — | 425,000 | — | ||||||||
| Debt issuance costs | — | — | (11,278) | — | ||||||||
| Purchase of capped call | — | — | (52,318) | — | ||||||||
| Repayment of commercial loan | — | — | (310) | (310) | ||||||||
| Proceeds from issuance of common stock | 3,753 | — | 103,326 | 500,000 | ||||||||
| Proceeds from issuance of common stock pursuant to stock options exercised | — | 1,124 | 49 | 19,980 | ||||||||
| Withholding taxes paid on behalf of employees on net settled stock-based awards | (505) | (7,622) | (3,984) | (23,401) | ||||||||
| Transaction costs related to issuance of common stock | (111) | (19) | (1,248) | (6,772) | ||||||||
| Net cash provided by (used in) financing activities | 3,035 | (6,552) | 459,003 | 489,357 | ||||||||
| Net decrease in cash, cash equivalents and restricted cash | (91,733) | (170,613) | (207,403) | (128,925) | ||||||||
| Cash, cash equivalents and restricted cash at beginning of period | 434,360 | 720,643 | 550,030 | 678,955 | ||||||||
| Cash, cash equivalents and restricted cash at end of period | $ | 342,627 | $ | 550,030 | $ | 342,627 | $ | 550,030 | ||||
| Cash and cash equivalents | $ | 302,291 | $ | 524,481 | $ | 302,291 | $ | 524,481 | ||||
| Restricted cash | 40,336 | 25,549 | 40,336 | 25,549 | ||||||||
| Cash, cash equivalents and restricted cash | $ | 342,627 | $ | 550,030 | $ | 342,627 | $ | 550,030 |
USE OF NON-GAAP FINANCIAL MEASURES
This press release references certain financial measures that are not prepared in accordance with generally accepted accounting principles in the United States (GAAP), including Adjusted EBITDA, non-GAAP selling, general and administrative expenses, non-GAAP research and development expenses and free cash flow. The Company defines Adjusted EBITDA as earnings before interest expense, income taxes, depreciation and amortization, stock-based compensation, and certain other items the Company believes are not indicative of its core operating performance. It defines non-GAAP selling, general and administrative expenses as selling, general and administrative expenses other than stock-based compensation and non-GAAP research and development expenses as research and development expenses other than stock-based compensation. It defines free cash flow as net cash provided by operating activities less capital expenditures. None of these non-GAAP financial measures is a substitute for or superior to measures prepared in accordance with GAAP and should not be considered as an alternative to any other measures derived in accordance with GAAP.
The Company believes that presenting these non-GAAP financial measures provides useful supplemental information to investors about the Company in understanding and evaluating its operating results, enhancing the overall understanding of its past performance and future prospects, and allowing for greater transparency with respect to key financial metrics used by its management in financial and operational-decision making. However, there are a number of limitations related to the use of non-GAAP measures and their nearest GAAP equivalents. For example, other companies may calculate non-GAAP measures differently, or may use other measures to calculate their financial performance, and therefore any non-GAAP measures the Company uses may not be directly comparable to similarly titled measures of other companies.
A reconciliation of net loss to Adjusted EBITDA for the three months ended December 31, 2022 and 2021 and years ended December 31, 2022 and 2021, respectively, is set forth below (in thousands):
| Three Months Ended December 31, 2022 | Three Months Ended December 31, 2021 | Year Ended December 31, 2022 | Year Ended December 31, 2021 | |||||||||
| Net loss | $ | (150,820) | $ | (80,797) | $ | (500,152) | $ | (352,899) | ||||
| Income tax expense | 529 | 5 | 598 | 79 | ||||||||
| Interest expense | 3,206 | 6 | 12,130 | 25 | ||||||||
| Depreciation and amortization | 3,117 | 2,883 | 11,098 | 11,518 | ||||||||
| EBITDA | (143,968) | (77,903) | (476,326) | (341,277) | ||||||||
| Stock-based compensation | 11,221 | 13,101 | 45,709 | 61,805 | ||||||||
| Change in fair value of warrants | — | — | — | 34,650 | ||||||||
| Adjusted EBITDA | $ | (132,747) | $ | (64,802) | $ | (430,617) | $ | (244,822) |
A reconciliation of selling, general and administrative expenses to non-GAAP selling, general and administrative expenses for the three months ended December 31, 2022 and 2021 and years ended December 31, 2022 and 2021, respectively, is set forth below (in thousands):
| Three Months Ended December 31, 2022 | Three Months Ended December 31, 2021 | Year Ended December 31, 2022 | Year Ended December 31, 2021 | |||||||||
| Selling, general and administrative expenses | $ | 47,298 | $ | 38,311 | $ | 175,118 | $ | 166,814 | ||||
| Stock-based compensation | 7,887 | 9,177 | 31,955 | 46,181 | ||||||||
| Non-GAAP selling, generaland administrative expenses | $ | 39,411 | $ | 29,134 | $ | 143,163 | $ | 120,633 |
A reconciliation of research and development expenses to non-GAAP research and development expenses for the three months ended December 31, 2022 and 2021 and years ended December 31, 2022 and 2021, respectively, are set forth below (in thousands):
| Three Months Ended December 31, 2022 | Three Months Ended December 31, 2021 | Year Ended December 31, 2022 | Year Ended December 31, 2021 | |||||||||
| Research and development expenses | $ | 102,596 | $ | 40,226 | $ | 314,174 | $ | 144,223 | ||||
| Stock-based compensation | 3,334 | 3,924 | 13,754 | 15,624 | ||||||||
| Non-GAAP research anddevelopment expenses | $ | 99,262 | $ | 36,302 | $ | 300,420 | $ | 128,599 |
The following table reconciles forecasted net cash used in operating activities to forecasted free cash flow for the three months ending March 31, 2023 (in thousands):
| Forecasted Range | ||
| Net cash used in operating activities | $(127,000)-$(133,000) | |
| Capital expenditures | $(8,000)-$(12,000) | |
| Free cash flow | $(135,000)-$(145,000) |