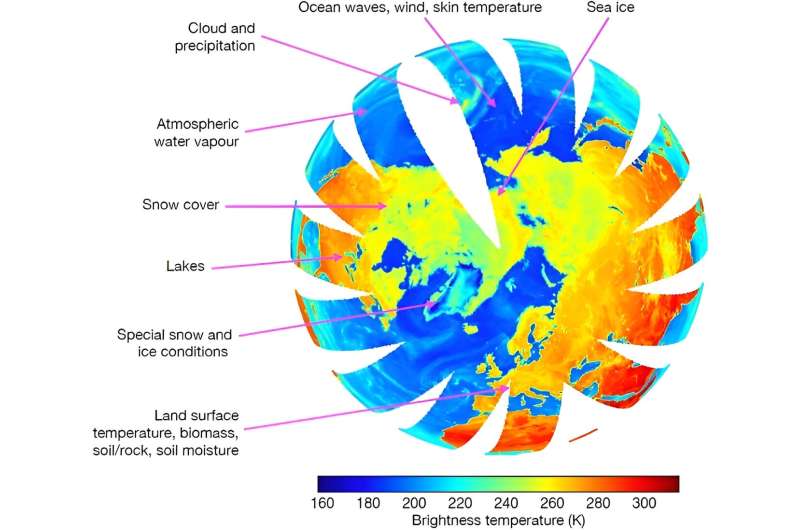
Data assimilation is the combination of the latest observations with a short-range forecast to obtain the best possible estimate of the current state of the Earth system. Machine learning can contribute to it by optimizing the use of satellite observations.
Obtaining the best possible estimate of the current state of the Earth system, known as the analysis, is extremely important for weather forecasting. That’s because the analysis serves as the initial conditions of forecasts.
To use the latest observations, we rely on a vast system of instruments that regularly measure aspects of the atmosphere and other components of the Earth system. Over the last few decades, satellite observations have become increasingly important.
They make frequent observations of the atmosphere and the surface across the globe. But their use over land and sea ice has been limited so far because of difficulties in correctly interpreting these observations.
“Machine learning makes it possible to arrive at a good interpretation of, for example, satellite observations over sea ice,” says ECMWF scientist Alan Geer.
Three benefits
Making full use of the information contained in satellite observations, regardless of cloudiness and across different surfaces, is called “all-sky, all-surface assimilation.”
All-surface assimilation can bring three benefits:
- we get more information on the atmospheric state in areas where satellite observations were previously discarded, such as sea ice, snow and land surfaces
- we get new information on poorly known variables, such as sea ice concentration, snow cover or soil moisture
- we can use the observations to help constrain, improve and develop better physical and empirical models of the Earth system.
Here, we shall take a closer look at the example of sea ice: How can we interpret satellite observations over sea ice to help us build as full a picture as possible of the state of the Earth system at a given point in time?
The current state of play
Microwave radiance observations from satellites are already used in the ECMWF sea ice analysis. However, they are introduced into the atmospheric analysis by a slow, roundabout, and sub-optimal route.
Sea ice concentration retrievals are first inferred by external data providers. They are then incorporated into a daily analysis at the UK Met Office. Subsequently, the daily analysis is assimilated into ECMWF’s OCEAN5 reanalysis/analysis system for the ocean and sea ice. Any observed changes in the sea ice finally reach the atmospheric data assimilation with an overall delay of around 48 to 72 hours.
“The delay can be eliminated if we can use our in-house data assimilation tools to infer the sea ice concentration directly from observed satellite radiances,” says Alan.
How machine learning comes in
A typical machine learning approach would attempt to learn the presence of sea ice from known inputs and outputs.
For the sea ice observation problem, we know the outputs: these are the satellite radiance observations. However, the inputs, including the microstructural details of the ice and snow that affect the observations, are basically unknown.
“To solve this problem, a year’s worth of microwave radiance observations were paired with atmospheric profiles from ECMWF short-range forecasts,” says Alan. “Machine learning tools were used to learn the sea ice state at the same time as an empirical model to represent the surface radiative transfer. Being able to learn these together was key to this project and needed a new approach to doing the machine learning.”
Better analyses
The illustration shows the resulting sea ice concentration analysis, compared with the OCEAN5 sea ice concentration, for 7 November 2020:
The OCEAN5 sea ice analysis is valid for the same time, but represents the Siberian side of the Arctic ocean as open water, due to the delays in the observed changes in sea ice reaching the analysis. The new approach, on the other hand, shows that these areas have already mostly frozen over.
An example of the quality of the new sea ice concentration analysis is also provided in the figure below.
The new sea ice analysis shows a signal for the giant A-68A iceberg close to the Southern Ocean island of South Georgia, whereas the iceberg is missing in the OCEAN5 analysis.
Better atmospheric forecasts
The addition of microwave observations in sea ice areas improves temperature forecasts in the Southern Ocean out to around day four, from the surface up to the mid-troposphere.
There is little impact on the Arctic forecast, probably because the year-round availability of in-situ measurements helps to fill any gaps in satellite data.
The sea ice assimilation described here is intended to become operational with Cycle 49r1 of ECMWF’s Integrated Forecasting System (IFS) in 2024.
Provided by
European Centre for Medium-Range Weather Forecasts (ECMWF)
How machine learning can support data assimilation for Earth system models (2023, November 7)
retrieved 8 November 2023
from https://phys.org/news/2023-11-machine-assimilation-earth.html
part may be reproduced without the written permission. The content is provided for information purposes only.